|
|
Order by Related
- New Release
- Rate
Results in Title For charts graphs
 | Add Powerful reporting features to your Web / Intranet pages and applications. With the advanced graphing package you will be quickly adding impressive dynamic charting capabilities bringing your data alive Powerful components provide both client server side solutions for adding graphs charts into web / intranet pages applications. Enabling web authors Java developers to easily build and publish dynamic interactive graphs charts. .. |
|
 | WebGrid free library package contains utilities used by WebGrid - plug and play grid and are found in the namespace "WebGrid.Util". In this package are WebGrid - free charts. A easy-to-use charting solution for unique and data presentation. ..
|
|
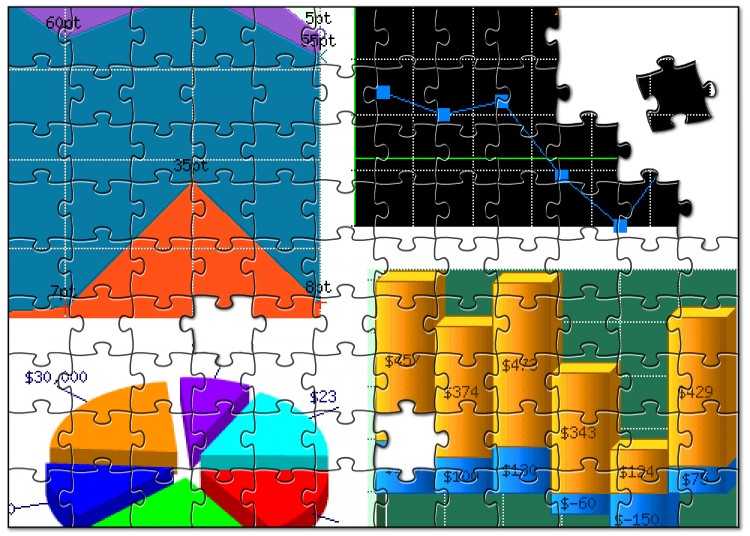 | Solve this super easy puzzle of graphs. Good for marketers. Can be solved in less than 10 minutes. .. |
|
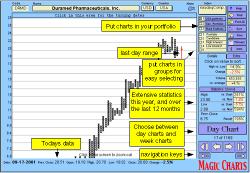 | Tool to follow the stock market using Point and Figure charts. Get a full set of updated Point and Figure charts every day in your mailbox and select easily which stock to buy and sell with the new Buy the Winner view. Comes with build in portfolio. ..
|
|
 | Theory of Biorhythm:
In early 20th century, Germany physician Wilhelm Fliess and Austrian psychologist Hermann Swoboda found human being Biorhythm cycles that emotion has a cycle of 28-days and physical has a cycle of 23-days.
After twenty years, Austrian professor Alfred Teltseher found that human being intelligence has a cycle of 33-days after studying hundreds of students. Now we know the following human being biorhythm cycles: Emotion cycle is 28-days. Physical cycle is 28-days. Intelligence cycle is 33-days. The start day to calculate a person's biorhythm is his( or her) birthday.
Benefits:
Predict your status in future. Arrange travel or important work. Calculate the best pregnant dates for a couple. Adjust your status and get high score in exam. Help you to decide whether he or she is your cup of tea. Help to affiliate better with your mate. Display two persons' biorhythm charts once. By comparing two persons' biorhythm charts you can predict their advantages and disadvantages.
Features of Biorhythm Charts:
Display one or two persons' biorhythm charts once.
Compare two persons' biorhythm charts
Adjust your status before exam to get a high score in the exam.
Find the best pregnant dates for a couple and have a healthy baby.
See whether a person is appropriate for you to become a happy family.
Seek mate.
Print biorhythm charts. .. |
|
 | World Stock Charts is a complete solution for Charting and Tracking Stocks, Funds and Indices with over 50 Forms of Technical Analysis built into it. ..
|
|
 | Theory of Biorhythm:In early 20th century, Germany physician Wilhelm Fliess and Austrian psychologist Hermann Swoboda found human being Biorhythm cycles that emotion has a cycle of 28-days and physical has a cycle of 23-days.After twenty years, Austrian professor Alfred Teltseher found that human being intelligence has a cycle of 33-days after studying hundreds of students. Now we know the following human being biorhythm cycles: Emotion cycle is 28-days. Physical cycle is 28-days. Intelligence cycle is 33-days. The start day to calculate a person's biorhythm is his( or her) birthday.Benefits: Predict your status in future. Arrange travel or important work. Calculate the best pregnant dates for a couple. Adjust your status and get high score in exam. Help you to decide whether he or she is your cup of tea. Help to affiliate better with your mate. Display two persons' biorhythm charts once. By comparing two persons' biorhythm charts you can predict their advantages and disadvantages.Features of Biorhythm Charts: Display one or two persons' biorhythm charts once.Compare two persons' biorhythm charts Adjust your status before exam to get a high score in the exam.Find the best pregnant dates for a couple and have a healthy baby.See whether a person is appropriate for you to become a happy family.Seek mate.Print biorhythm charts. .. |
|
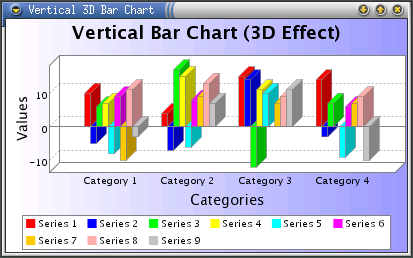
 | ADSS Charts Control designed to display three types of Charts: Horizontal bar Chart, Vertical bar Chart, Pie Chart, key Features: supports Captions and Values.
Text can be aligned,control allows to display text information inside and outside chart elements.
Chart data can be grouped in Groups. Can be updated in real-time for creating of animated Charts. Control provides high quality image. .. |
|
 | Point & Figure Charts software is a stock analysis tool for individual investors and traders to identify buy-and-sell signals. The premier feature is Point & Figure Chart that is implemented with classic scale and custom scale. and much more. .. |
|
| Advanced Trading Research provides extremely accurate trading tools for institutions and day traders. We in real time analyze order flow sent to electronic trading systems and ECNs such as Island. The source data we receive is similar to the data other companies like 3D stockcharts use but the use and end result differ vastly.
We have during the last two years developed, patented and are now marketing our first generation tool which we call the True Trend Charts. The True Trend Charts does what it's name indicates, it in real-time shows in a very easy to use graph exactly how over- or undervalued the intraday market is at any given time throughout the trading day. This allows a trader to know if a current move in the intraday market is false and if it is extremely likely to reverse.
The True Trend charts also show the true intraday support and resistance of the major market indices. It is so accurate that it very often can tell you several hours in advance what direction the market will go in and exactly on the cent where the market will stop or reverse. Traders often can profit from intraday market swings of several percent since we give them a reference of if the intraday market is high or low. .. |
|
Results in Keywords For charts graphs
 | ActiveX control to draw 2D pie charts, bar charts and line graphs. Display the graphs, export to file (GIF, PNG, BMP) or data stream or copy to the clipboard. Properties allow full control over colours and fonts. Free trial... |
|
 | This ASP.NET component draws pie and bar charts and line graphs on the fly. Graphs can be streamed to the browser as GIF or JPG images or saved to file. A wide range of properties allow the customisation of colour, size and text style...
|
|
 | This ASP component draws pie and bar charts and line graphs on the fly . Output options include GIF, PNG, JPG and BMP. Stream to browser or save as a file. A wide range of properties allow the customisation of colour, size and text style... |
|
 | Digitize graphs and charts quickly with our Excel based spreadsheet software. Log, linear, date and time scales, distance measurement and angle determination capability also. Free upgrades forever!..
|
|
| Add Powerful reporting features to your Web / Intranet pages and applications. With the advanced graphing package you will be quickly adding impressive dynamic charting capabilities bringing your data alive Powerful components provide both client server side solutions for adding graphs charts into web / intranet pages applications. Enabling web authors Java developers to easily build and publish dynamic interactive graphs charts... |
|
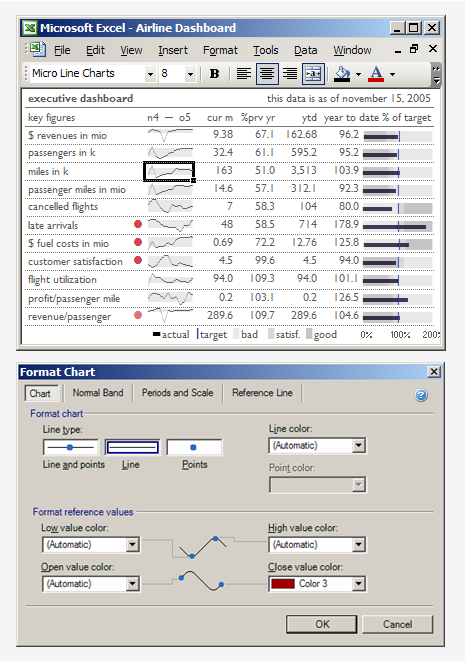 | MicroCharts allows you to create richer, more concise Excel reports and dashboards with more information per square inch. These data-rich, word-sized charts and graphs clearly visualize business data for better decision-making...
|
|
 | Add Powerful reporting features to your Web / Intranet pages and applications. With advanced graphing you will be quickly adding impressive and dynamic charting capabilities bringing your data alive ! The PHP graphing scripts provide a very easy way to embed dynamically generated graphs and charts into PHP applications and HTML web pages.Very easy to use and add professional quality graphing to web pages / applications in minutes. Try for free. The Graphing components provide solutions for the incorporation of graphs & charts into web / intranet pages and applications. Versatile components provide the ability for web authors and Java developers to easily build and publish dynamic and interactive graphs & charts... |
|
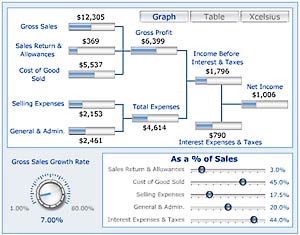 | Bring your data presentation to life with Xcelsius|XL Professional. Xcelsius combines a simple .. |
|
 | Graphing, curve fitting and calculating software. Graphs Cartesian, polar and parametric functions, graphs of tables, implicit functions and inequalities. Calculus features: regression analysis, derivatives, tangents, normals and more... |
|
| Have you ever plot graph? So you know that it is too hard to do it using only paper and pen. MasterGraph can solve you problem. MasterGraph plots graphs of both simple and exceedingly complex mathematical functions. MasterGraph is the easiest way to plot and analyze graphs. It saves and prints images of graphs, zooms in/out. Screen keyboard lets you to type expressions easy and fast. There are 5 patterns of the most general types of functions such as "line", "parabola", "hyperbola", etc. Canvas has rich settings of appearance: color, spacing, fonts. .. |
|
Results in Description For charts graphs
| This ASP.NET component draws pie and bar charts and line graphs on the fly. Graphs can be streamed to the browser as GIF or JPG images or saved to file. A wide range of properties allow the customisation of colour, size and text style... |
|
 | Chart java applet software to generate dynamic charts and graphs - bar, line, pie, stacked and grouped charts in 2D and 3D with a wide range of parameters and chart types...
|
|
 | Chart java applet software to generate dynamic charts and graphs - bar, line, pie, stacked and grouped charts in 2D and 3D with a wide range of parameters and chart types... |
|
 | Set of Php Classes for creating charts and graphs. It supports more than 18 types (linechart, piechart, barchart, radarchart, curves , gauges, 3D charts, Candlestick, areacharts ....) and combinations of them.
It supports also database access, automatic scales (dates and logarithmic) and interactive features using image maps (tips and links). You can create charts with minimum programming...
|
|
| Add Powerful reporting features to your Web / Intranet pages and applications. With the advanced graphing package you will be quickly adding impressive dynamic charting capabilities bringing your data alive Powerful components provide both client server side solutions for adding graphs charts into web / intranet pages applications. Enabling web authors Java developers to easily build and publish dynamic interactive graphs charts... |
|
 | JFreeChart is a free Java class library for generating charts. It includes support for pie charts, bar charts (regular, interval and stacked, optional 3D effect), line charts, scatter plots, time series charts, high-low-open-close, candlestick plots, Gantt charts, combination charts and more. ..
|
|
 | Chart java application software to generate dynamic charts and graphs within JSP, servlets or java applications - bar, line, pie, stacked and grouped charts in 2D and 3D with a wide range of parameters and chart types... |
|
 | Chart java application software to generate dynamic charts and graphs within JSP, servlets or java applications - bar, line, pie, stacked and grouped charts in 2D and 3D with a wide range of parameters and chart types... |
|
 | The 2D / 3D Line Graph provides a client and server side solution for the incorporation of line graphs & charts into web pages. Versatile components so web authors and Java developers can easily build and publish dynamic and interactive line charts... |
|
| A "scientific data visualization" application. Its displays databases, usually numerical, in ways that make it easier to understand the data. In other words, it.s "graphing on steroids." However, Flying Fox goes far beyond traditional graphs. It displays data in other formats, such as: waves, spectrograms, frequency analysis, bitmaps, contours, lattices, flow charts, Gaussian scatter graphs, 3D scatter graphs, 3D topography, and 3D physical simulation data. .. |
|
Results in Tags For charts graphs
| Add Powerful reporting features to your Web / Intranet pages and applications. With the advanced graphing package you will be quickly adding impressive dynamic charting capabilities bringing your data alive Powerful components provide both client server side solutions for adding graphs charts into web / intranet pages applications. Enabling web authors Java developers to easily build and publish dynamic interactive graphs charts... |
|
 | FusionCharts v3 helps you create animated and interactive Flash charts for web and desktop applications. It livens up your applications by converting monotonous data into exciting visuals...
|
|
 | ZoomChart - the interactive charting tool for your website
ZoomChart is a powerful Java applet for charting data on the internet. Simply integrate your data with our plug and play software for charting content in minutes. Plot unlimited lines of historical or real time data and customise the chart look and feel with simple html changes. Website users can select and deselect lines and zoom in and out of data interactively. Free eval download and unique online service providing free hosting of slimline ZoomChart edition... |
|
| This ASP component draws pie and bar charts and line graphs on the fly . Output options include GIF, PNG, JPG and BMP. Stream to browser or save as a file. A wide range of properties allow the customisation of colour, size and text style...
|
|
| MicroCharts allows you to create richer, more concise Excel reports and dashboards with more information per square inch. These data-rich, word-sized charts and graphs clearly visualize business data for better decision-making... |
|
 | Rich Chart Builder transforms your data charts into enjoyable and captivating communication. Data charts don't have to be plain and austere, they can be interactive experiences with attractive visuals, animation and even voice explanations describing the important facts behind the numbers.
Features and Benefits:
- Impressive Charts: Create stunning Rich Media charts that present data in an enjoyable and captivating experience. Includes sophisticated 3D and shaded chart styles.
- Interactivity: Create interactive charts with tooltips and drill-down links that can point to other charts and web documents, creating a truly interactive experience.
- Communication: Charts can contain an audio narration - an effective way of describing the events behind the values.
- Flash Rich Media: Publish the animated charts to Macromedia Flash format, viewable by over 98% of web users.
- Publish to PowerPoint: Impress audiences with compelling charts published to PowerPoint presentations. Also publish to image and PDF documents.
- Templates and Layouts: Enhance data charts with a wealth of professionally designed chart Templates and Layouts.
- Simple Data Import: Works with Microsoft Office - easily import data from Excel. Also import data from other spreadsheets.
- Unicode Support: Supports charts with values in Japanese, Chinese and other Unicode languages...
|
|
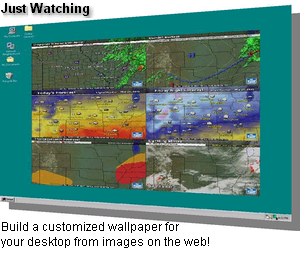 | Imagine that you could continuously monitor multiple online images without having to open your browser! Use Just Watching to build a custom wallpaper that can display web cams, stock charts, weather maps and home security cams right on your desktop!.. |
|
 | Rich Chart Server generates captivating dynamic Flash charts from ASP.NET. Visually design a chart template with animation, audio, annotations and links. Apply the template to any available .NET data source to generate a interactive Flash chart... |
|
 | Web Enabled solution for creating Stacked Horizontal Charts & Graphs. Web Authors and Developers can easily build and publish dynamic graphs. Free Trial and Money Back Guarantee, try it out today... |
|
| WebGrid free library package contains utilities used by WebGrid - plug and play grid and are found in the namespace "WebGrid.Util". In this package are WebGrid - free charts. A easy-to-use charting solution for unique and data presentation... |
|
Related search : bar charts,charts withdata chartschart builderrich chart,rich chart builderimport data fromchart builder richbuilder rich chart,rich chartcharts withchart serverasp net,rich chart serverwindows forms applicationschart server richserver rich chartstacOrder by Related
- New Release
- Rate
use graphs -
x y graphs -
c graphs -
custom graphs -
graphs plotting -
|
|