|
|
Order by Related
- New Release
- Rate
Results in Title For graphs
 | Add Powerful reporting features to your Web / Intranet pages and applications. With the advanced graphing package you will be quickly adding impressive dynamic charting capabilities bringing your data alive Powerful components provide both client server side solutions for adding graphs charts into web / intranet pages applications. Enabling web authors Java developers to easily build and publish dynamic interactive graphs charts. .. |
|
Results in Keywords For graphs
 | Scientific data visualization software. Creating vertex, grid and surface model, color map, contour plot, vector plot, 4D scatter, 4D slice and 4D vector... |
|
 | DigitizeIt can automatically digitize (x,y)-data from scanned graphs. Data values are transformed to a specified axes system and can be saved in ASCII format, ready to use in other applications. Can read most image formats (gif, png, tiff,bmp)...
|
|
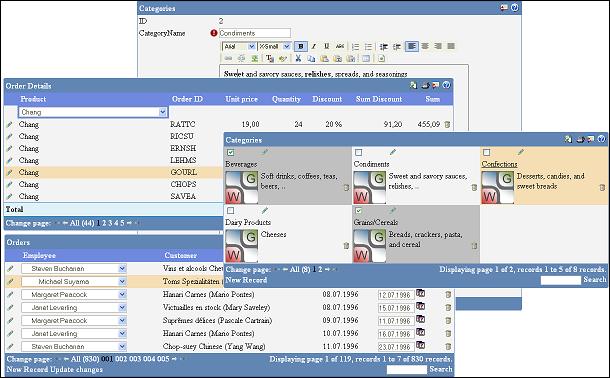 | WebGrid have 12 column types, 40 events, and have more then 100 properties for you to play with. This enables you to create faster and better web applications with an unequaled level of customization... |
|
 | Equation grapher is a free graphing calculator to graph equations. Equation Grapher is a free graphing calculator to graph equations. Equation Grapher is a free graphing calculator to graph equations...
|
|
 | Graphing, curve fitting and calculating software. Graphs Cartesian, polar and parametric functions, graphs of tables, implicit functions and inequalities. Calculus features: regression analysis, derivatives, tangents, normals and more... |
|
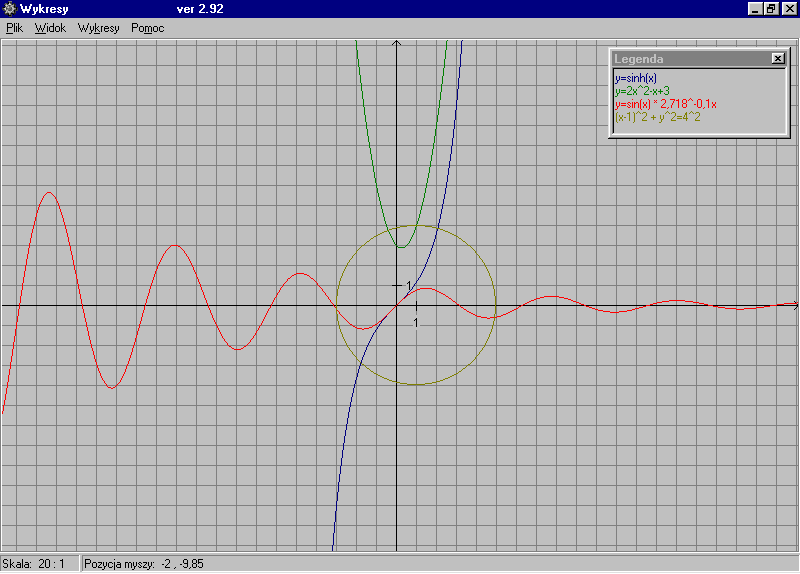 | Wykresy draws graphs of various functions and makes calculations on them. It allows user to see up to 10 graphs simutaniously and save them to a file or copy to clipboard as an image...
|
|
 | 3D Grapher is a feature-rich yet easy-to-use graph plotting and data visualization software suitable for students, engineers and everybody who needs to work with 2D and 3D graphs. With 3D Grapher you can easily plot the equation and table-based graphs, zoom them, rotate, view at any angle and even animate. You can draw the unlimited number of graphs in one coordinate system to visualize and analyze the domains of functions and their intercepts... |
|
Results in Description For graphs
 | Joel`s Journal is a software program designed to help you learn to hear God`s voice through journaling your dreams and visions. Features include automatic spell checking, powerful search, graphs, automatic saves and backups, and much more... |
|
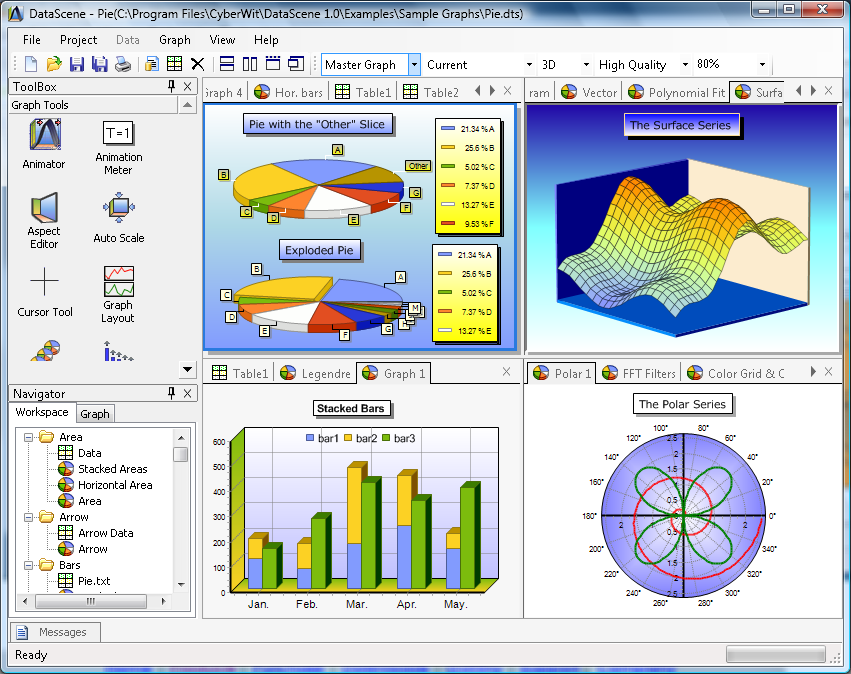 | DataScene is a scientific graphing, data analysis, curve fitting, and data monitoring program. It allows the user to plot 39 types 2D & 3D graphs, to create animated graphs from data and models, to analyze data, and to chart real-time data sources...
|
|
 | DISLIN is a high-level and easy to use plotting library for displaying data as curves, bar graphs, pie charts, 3D-colour plots, surfaces, contours and maps. Several output formats are supported such as X11, VGA, PostScript, PDF, CGM, PNG and TIFF... |
|
 | DISLIN is a high-level and easy to use plotting library for displaying data as curves, bar graphs, pie charts, 3D-colour plots, surfaces, contours and maps. Several output formats are supported such as X11, VGA, PostScript, PDF, CGM, PNG and TIFF...
|
|
 | DISLIN is a high-level and easy to use plotting library for displaying data as curves, bar graphs, pie charts, 3D-colour plots, surfaces, contours and maps. Several output formats are supported such as X11, VGA, PostScript, PDF, CGM, PNG and TIFF... |
|
| DISLIN is a high-level and easy to use plotting library for displaying data as curves, bar graphs, pie charts, 3D-colour plots, surfaces, contours and maps. Several output formats are supported such as X11, VGA, PostScript, PDF, CGM, PNG and TIFF...
|
|
| DISLIN is a high-level and easy to use plotting library for displaying data as curves, bar graphs, pie charts, 3D-colour plots, surfaces, contours and maps. Several output formats are supported such as X11, VGA, PostScript, PDF, CGM, PNG and TIFF... |
|
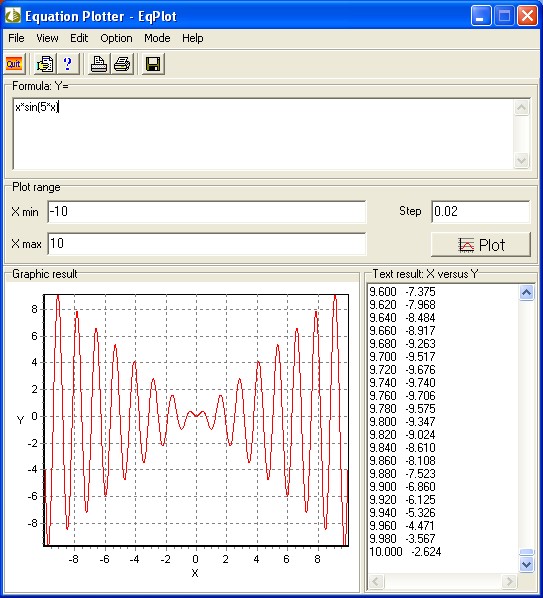 | Graph plotter program plots 2D graphs from complex equations. The application comprises algebraic, trigonometric, hyperbolic and transcendental functions. EqPlot can be used to verify the results of nonlinear regression analysis program... |
|
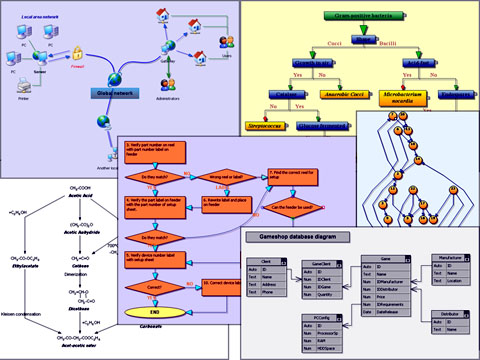 | FlowChartX is an ActiveX control that helps you create and present workflow, flowchart and process diagrams, database entity-relationship diagrams, organizational, hierarchy and relationship charts, network schemes, graphs and trees... |
|
 | JDiagram is a Java component that helps you create and present workflow, flowchart and process diagrams, database entity-relationship diagrams, organizational, hierarchy and relationship charts, network schemes, graphs and trees... |
|
Results in Tags For graphs
 | Keep your investments private! - Money, Stock and portfolio management. - Stock prices via internet - realtime - FREE. - Many companies from start. - Technical analysis. - Graphics, reports, hints & ideas, and much more. - Easy to use software... |
|
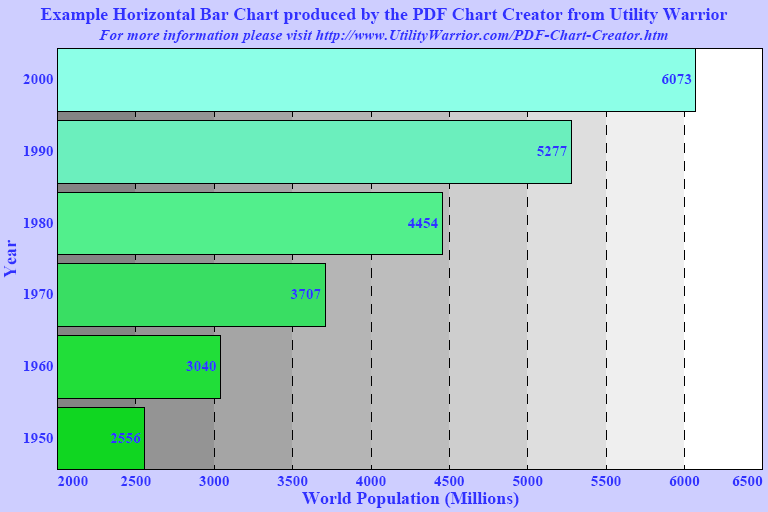 | PDF Chart Creator is a utility that converts data into a chart PDF document. The conversion process is initiated by calling PDFChart.exe directly from the command line, or from within a batch file, with parameters that control it`s operation...
|
|
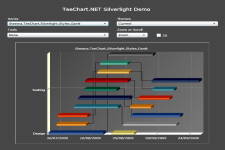 | Charting component library for Microsoft.NET applications. It supports WinForms, WPF, ASP.NET, CF and SQL Reporting Services and it offers portable charts for Silverlight and Flash and a new combination gauge types for dashboard applications... |
|
| DigitizeIt can automatically digitize (x,y)-data from scanned graphs. Data values are transformed to a specified axes system and can be saved in ASCII format, ready to use in other applications. Can read most image formats (gif, png, tiff,bmp)...
|
|
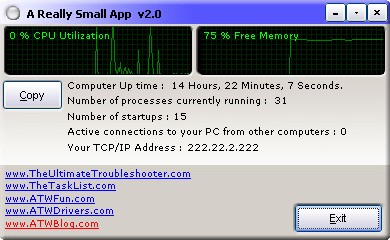 | Handy System Tray graphs and statistics utility which allows you to keep track of your memory and CPU utilization with one click of the mouse. It also provides the user with the facility to change the default printer straight from the System Tray... |
|
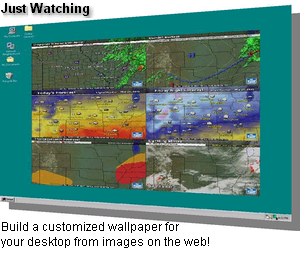 | Imagine that you could continuously monitor multiple online images without having to open your browser! Use Just Watching to build a custom wallpaper that can display web cams, stock charts, weather maps and home security cams right on your desktop!..
|
|
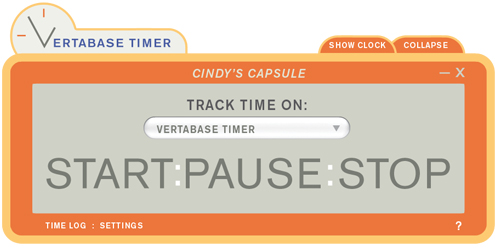 | Fun & Easy Time Tracking tool with record keeping timelog. Track time on projects, clients & tasks. Personalize it. Built in stopwatch with bill rates per task, task notes, fast task entry. Graphs & charts. Export to MS Excel or XML. PC & MAC... |
|
 | Sitemonitor (SM) is a website monitoring program that monitors website status and browser load times (cached and uncached) at a user specified time period. It supports pop up, voice and email notification... |
|
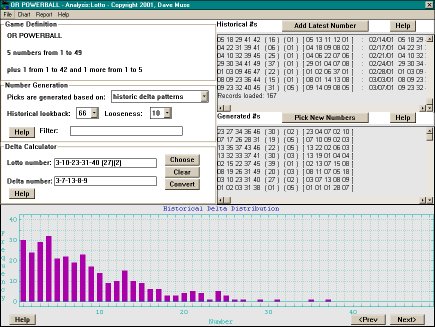 | Which seems like the better bet to you: Pick 6 lotto numbers from 50 possibilities ... or 6 numbers from only FIFTEEN? Let Analysis Lotto show you how to pick winners for ANY lotto, lottery or keno game from a mere handful of numbers!.. |
|
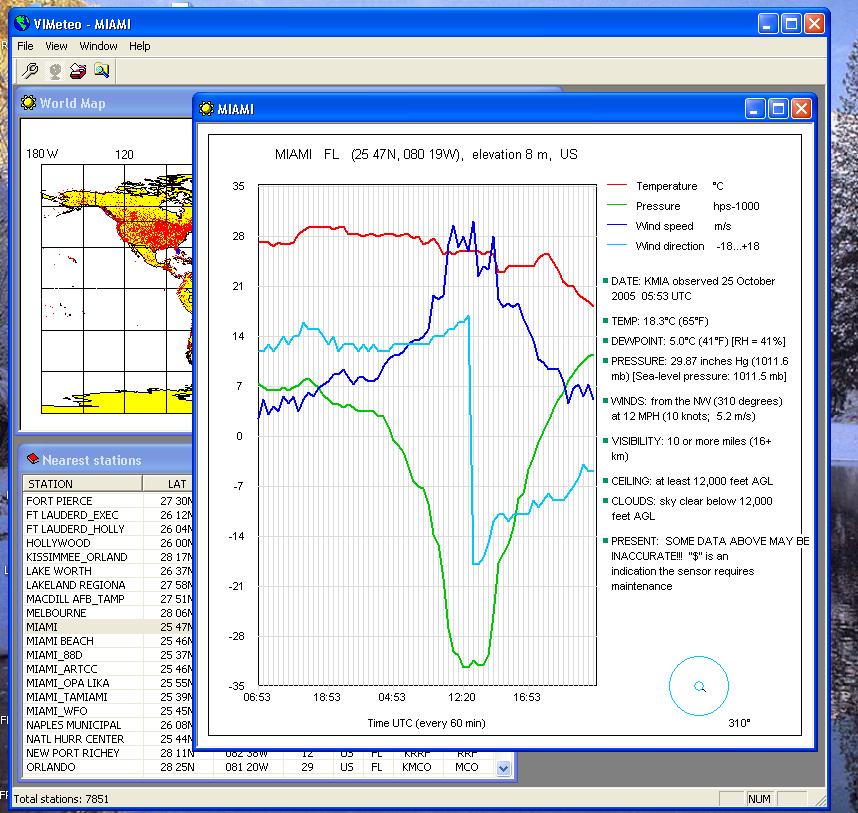 | - Real-time weather data from 7000 stations all around the world. - Diagramms for weather data. - History of weather data for the past 1 - 60 hours. - USA or European style. - Frendly user interface... |
|
Related search : ommand linechart creatorpdf chart,pdf chart creatorsupporting chart typescommand line toolcreator command linechart creator command,native chart formatnet charting control,really smallsmall appsystem tray,higher than zero,track timetime trackingvertaOrder by Related
- New Release
- Rate
graphs plotting -
netcf graphs c -
tiny graphs -
circle graphs -
drawing graphs -
|
|